
6/19/2020
In our previous blog posts, UI Automation for Monitoring and Observability & Containerizing Your Python-Selenium UI Automation Project, we learned how to use UI automation to capture metrics on Synthetic Transactions. We also learned how we can package our project into a Docker Container for easily portable deployments. In this post we will explore other tools that will help us to completely automate the fetching of our Synthetic Transaction metrics and visualize them too!
Tools
Several tools exist in the open source world that enable robust monitoring of applications and infrastructure. To name a few, we have Graphite, InfluxDB, OpenTSDB, and Prometheus. These tools fit in a class of databases called Time Series Databases (TSDB). The overall architectures and functionality of each one are a bit different from each other.
While the TSDBs above are focused more on collecting and storing metrics, they can be weak on the front of displaying that data. A very popular opensource dashboarding tool that has native support and connections to several of the TSDBs mentioned above is called Grafana. Pick a TSDB, pair it with Grafana, and you have the basis for a monitoring and observability platform.
In the commercial tools world, these open source monitoring and observability platforms are comparable to tools like Splunk, New Relic, and Honeycomb. For our particular Synthetic Transactions, we will be using Prometheus and Grafana to collect, store, and visualize the metrics that we have worked on in previous posts. But first, a bit more about Prometheus and Grafana.
Prometheus
Prometheus is a product of the Cloud Native Computing Foundation (CNCF). What is Cloud Native technology? From their GitHub repository, the CNCF defines Cloud Native Technology as:
Cloud native technologies empower organizations to build and run scalable applications in modern, dynamic environments such as public, private, and hybrid clouds. Containers, service meshes, microservices, immutable infrastructure, and declarative APIs exemplify this approach.
These techniques enable loosely coupled systems that are resilient, manageable, and observable. Combined with robust automation, they allow engineers to make high-impact changes frequently and predictably with minimal toil.
The Cloud Native Computing Foundation seeks to drive adoption of this paradigm by fostering and sustaining an ecosystem of open source, vendor-neutral projects. We democratize state-of-the-art patterns to make these innovations accessible for everyone.
So how does Prometheus fit this definition? As we will see in upcoming examples, Prometheus is easily deployable into any Cloud infrastructure, and better yet, Prometheus and it's components come in ready to go Containers. Running Prometheus is fairly straightforward, and collecting various metrics is largely a configurable task, thus making predictable high-impact changes is easily accomplished with the right setup.
Architecture & Components
A general Prometheus architecture is shown below. The components highlighted in orange boxes are products of Prometheus. The other color highlighted boxes like Granfana, Pagerduty, or Kubernetes within the Service discovery box have native support and connections to Prometheus.
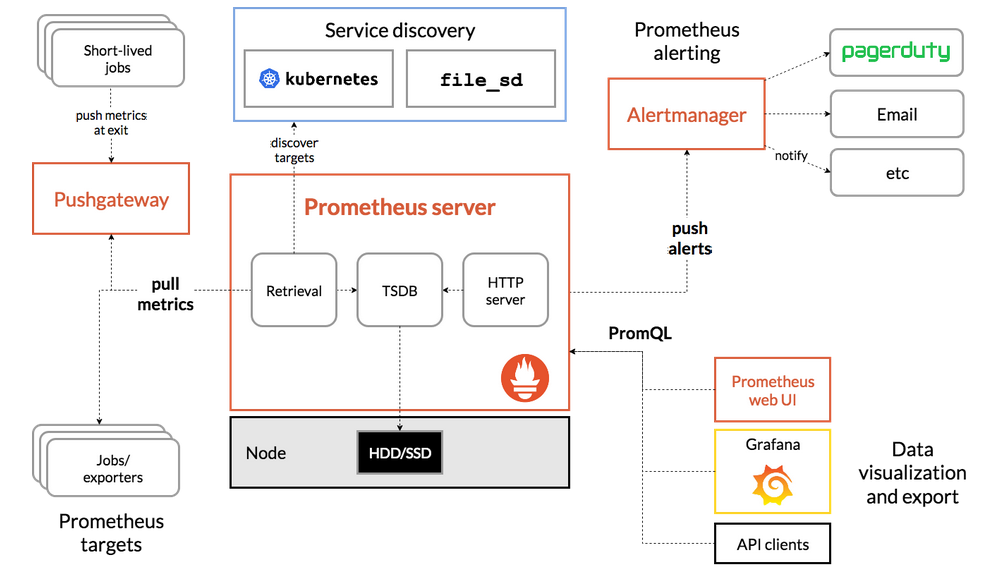
In the center of the architecture diagram, we have the core of Prometheus, the actual TSDB, the HTTP server and the data Retrieval component. Let's focus more on the left side of the architecture where metrics are pulled from the "Jobs/exporters" and the "PushGateway".
Exporters
As we can gather from the "pull metrics" route on the left side of the architecture diagram, Prometheus is a pull based system as far a s collecting metrics is concerned. An Exporter is a third-party program which is instrumented to collect metrics from a system, and export those metrics in a format that the Prometheus TSDB can ingest.
There are several different types of Exporters that collect metrics from various types of systems such as Linux machines, Windows machines, databases, and many other third party software and APIs. A good starting point to find an Exporter that you might be interested in using is at Prometheus Exporters where you will find an extensive list of Exporters, both official and un-official.
An Oficial Exporter is one that is maintained as part of the Prometheus GitHub Organization. Take for example, the Node Exporter. The Node Exporter is capable of collecting OS level metrics from Linux type systems. The number of metrics is extensive, but some examples are statistics on CPU usage, disk I/O, filesystem, entropy, memory, and many more.
Pushgateway
As Exporters monitor and collect metrics on defined intervals of time, some cases of collecting metrics do not particularly fit this type of regular monitoring intervals. Sometimes, you might want to monitor times when a batch job has started or completed; or perhaps you may want to know when a particular file has arrived in a specified directory. These cases are better suited for the Pushgateway where metrics are "pushed" when ready instead of regularly collected.
Prometheus and many of the third-party Exporters are written in Go. However, there exist SDKs for other languages such as Python, Go, Java, and Ruby for when the need arises to instrument custom collectors and exporters.
Grafana
Grafana is a product of Grafana Labs. It is a very robust dashboarding and visualization tool. Like Prometheus, it is opensource and also written in Go. If you've never interacted with Grafana, then check out the live demo site to get a good feel for it.
Let's go over some of the features Grafana has to offer:
- Grafana in a Container https://hub.docker.com/r/grafana/grafana
- Native support for Prometheus as a data source
- Native support for Amazon CloudWatch as a data source
- Visualization of real-time data
- Dynamic dashboards and filtering of metrics
- Define rules for Alerts and configure various notification endpoints
- Explore and analyze application logs such as those collected by Loki
- A plethora of ready-to-go dashboards, built by members of the large Grafana community, and many of which display metrics produced by the Prometheus Exporters discussed above.
- Various authentication methods including those which may be found in a typical Enterprise organization
- Option for Enterprise Support and Enterprise level plugins for Splunk, ServiceNow, Oracle DB, as well as several other plugins that are free and opensource
We could go on and on talking about Grafana, but it's probably best to just dive right in and experiment with it yourself. Continue reading to see how to run Grafana on your own machine and configure a simple dashboard showing metrics for our Synthetic Transactions project.
Instrumenting Exporters for Prometheus
We add to our syn_airpa.py program from previous blog posts in such a way that we export the metrics we are collecting in a format for Prometheus. Since we originally wrote our program in Python, we will utilize the Python Client for Prometheus.
Without changing our original syn_airpa.py code too much from our previous blog posts, we simply need to build a class that collects the metrics we have already been capturing with Synthetic Transactions. Then we run a HTTP server that hosts the metrics which Prometheus will pull at a regular interval. The code can be found on my GitHub repo, so feel free to clone https://github.com/airpaio/prometheus-synthetic-transactions and follow along.
class SyntheticCollector():
    '''
    SyntheticCollector utilizes the prometheus_client to collect and export metrics
    '''
    def collect(self):
        '''
        collect is the method that defines the metrics and collects them to publish them
        at your /metrics endpoint that Prometheus will scrape from.
        '''
        metrics = {}
        metrics = {
            'landing_page': GaugeMetricFamily(
                'synthetic_time_to_landing_page',
                'The page load time for navigating to "https:airpa.io/login".',
                labels=["synthetic_app"]
            ),
            'login': GaugeMetricFamily(
                'synthetic_time_to_login',
                'The duration of page load time for logging into "https:airpa.io/login".',
                labels=["synthetic_app"]
            ),
            'logout': GaugeMetricFamily(
                'synthetic_time_to_logout',
                'The duration of page load time for logging out of "https:airpa.io".',
                labels=["synthetic_app"]
            )
        }

        # run the synthetic transaction to get the metrics
        print('Collecting synthetic metrics for "synthetic_app": "airpa"...')
        landing, login, logout = synthetic_run('username', 'password')
        print("Time to landing page: {}".format(landing))
        print("Time to login: {}".format(login))
        print("Time to logout: {}".format(logout))

        # add the metrics to the prometheus collector
        metrics['landing_page'].add_metric(labels=["airpa"], value=landing)
        metrics['login'].add_metric(labels=["airpa"], value=login)
        metrics['logout'].add_metric(labels=["airpa"], value=logout)

        for metric in metrics.values():
            yield metric

        print("Finished running collect().")
As we see in the code snippet above, we implement a SyntheticCollector class with a method named collect. Basically this method does three things:
- define 3 Gauge metrics in a dictionary
- run the "Synthetic Transactions" function
synthetic_runwhich just contains the UI actions and timing blocks just like we had in the originalsyn_airpa.pyscript from our previous posts - add these metrics to the collection that will be exported to Prometheus
Last but not least, we define and call a "main" function which starts the HTTP server listening on port 9901, and registers our SyntheticCollector class to export the metrics to Prometheus.
def main():
    start_http_server(port=9901)
    print('Listening on localhost:9901')
    print('Metrics will be scraped from http://127.0.0.1:9901/synthetic-metrics')
    REGISTRY.register(SyntheticCollector())
    while True:
        time.sleep(1)

main()
We could run this program as is, and everytime we visit or refresh the page on http://127.0.0.1:9901/synthetic-metrics, the program would commence the collection of metrics from the Synthetic Transactions. But, of course we will do this the Container way and build a Docker Image for this program. Using the same Dockerfile from the previous post, we run
docker build --rm=true -t prometheus-synthetic-airpa .
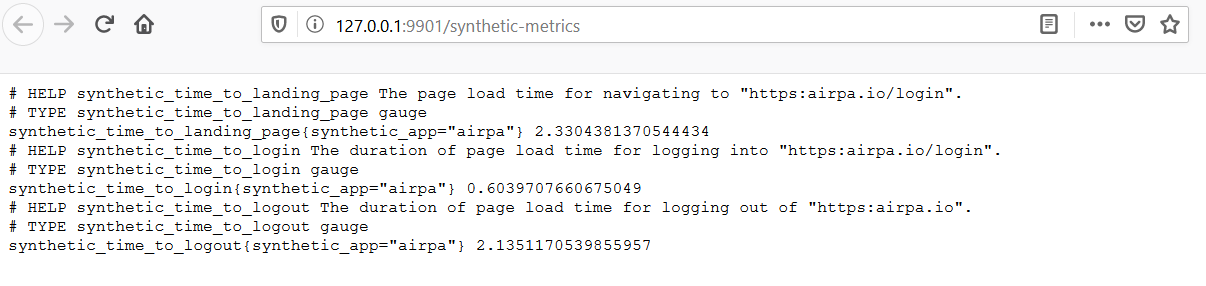
to build a new image functioning as a Prometheus Exporter for our Synthetic Transactions. Run the Container with the command
docker run -p 9901:9901 prometheus-synthetic-airpa
and visit http://127.0.0.1:9901/synthetic-metrics where you should see results similar to this:
Multiple Containers
Now we have packaged our Prometheus Exporter for Synthetic Transactions into a Docker Image. Prometheus and Grafana both have their own Docker Images. If we were to use other Prometheus Exporters, then they likely have their own Docker Images too, or could easily be packaged into a Docker Image. So how exactly do we run all of these Containers simultaneously? We could run several different Docker commands, potentially long commands with several flags, but that doesn't sound like much fun, and honestly I would forget how to run each command anytime I needed to start the whole project up.
There are several solutions available for running and orchestrating multiple Containers such as Kubernetes, Docker Swarm, and Docker Compose. We won't compare them too much here, and you can search for other blog posts that compare each of these methods in depth. I will say that Kubernetes is probably the most complex method while Docker Compose is likely the simplest to understand. With that in mind, let's follow the KISS principle for now and let me show you the Docker Compose method.
Docker Compose
Basically Docker Compose is a way of specifying a configuration of running multiple Docker Containers within a single YAML file. Here is our docker-compose.yml file:
version: '3'
networks:
    monitoring-net:
        driver: bridge
services:
    prometheus:
        image: prom/prometheus:latest
        container_name: monitoring_prometheus
        restart: unless-stopped
        volumes:
            - ./prometheus.yml:/etc/prometheus/prometheus.yml
            - ./data/prometheus:/prometheus
        command:
            - '--config.file=/etc/prometheus/prometheus.yml'
        expose:
            - 9090
        ports:
            - '9090:9090'
        networks:
            - monitoring-net
        links:
            - synthetic-airpa
    synthetic-airpa:
        image: prometheus-synthetic-airpa
        container_name: monitoring_synthetic_airpa
        restart: unless-stopped
        expose:
            - 9901
        ports:
            - '9901:9901'
        networks:
            - monitoring-net
    grafana:
        image: grafana/grafana:latest
        container_name: monitoring_grafana
        restart: unless-stopped
        links:
            - prometheus:prometheus
        volumes:
            - ./data/grafana:/var/lib/grafana
        expose:
            - 3000
        ports:
            - 3000:3000
In the docker-compose.yml file, we define one network named "monitoring-net" which the Conatiners will use to communicate with each other. We also define three services, namely "prometheus", "synthetic-airpa", and "grafana".
Within these services, we define:
- which Images Docker should use to run the Containers,
- names for each Container
- Docker Volumes to persist our data across Container restarts
- configuration files to use under the "command" key
- ports to expose and bind to with each container
Now spinning up all of these Containers simultaneously is just a matter of running the command
docker-compose up -d
Here are some other useful commands you might run with Docker Compose:
- Stop your running Containers -
docker-compose down - Restart all running Containers -
docker-compose restart - Restart a specific Container -
docker-compose restart grafana
Now that we have our project up and running in multiple Containers, let's take a look at what's going on.
Prometheus
Navigate in your browser to http://127.0.0.1:9090 and you will find the Prometheus Web UI. Here, we execute a simple query to graph the metric "synthetic_time_to_landing_page" over the last 5 minutes we have had our Containers up and running.
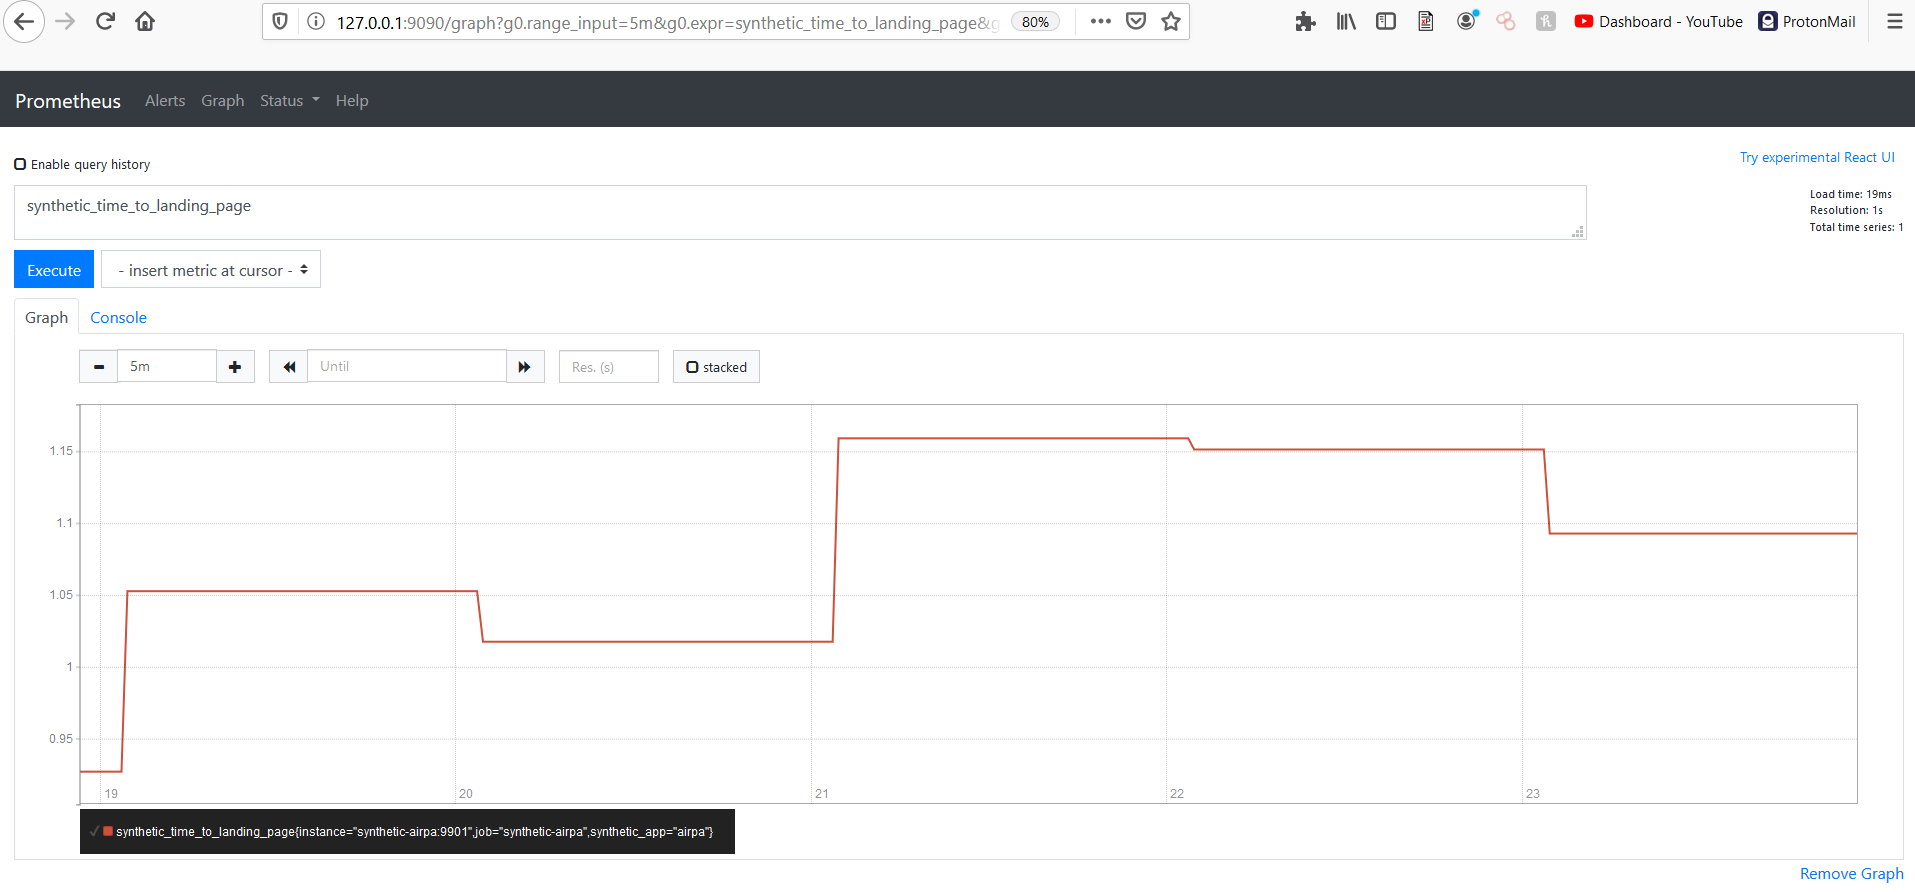
We won't spend too much time here, and I encourage you to have a good look around the Prometheus Web UI to see what all it has to offer. Let's move on to creating a dashboard in Grafana.
Grafana
Go ahead and navigate to http://127.0.0.1:3000 where you will find a login screen for Grafana. The default credentials are "admin", "admin", and you will be prompted to change the password upon your first login.
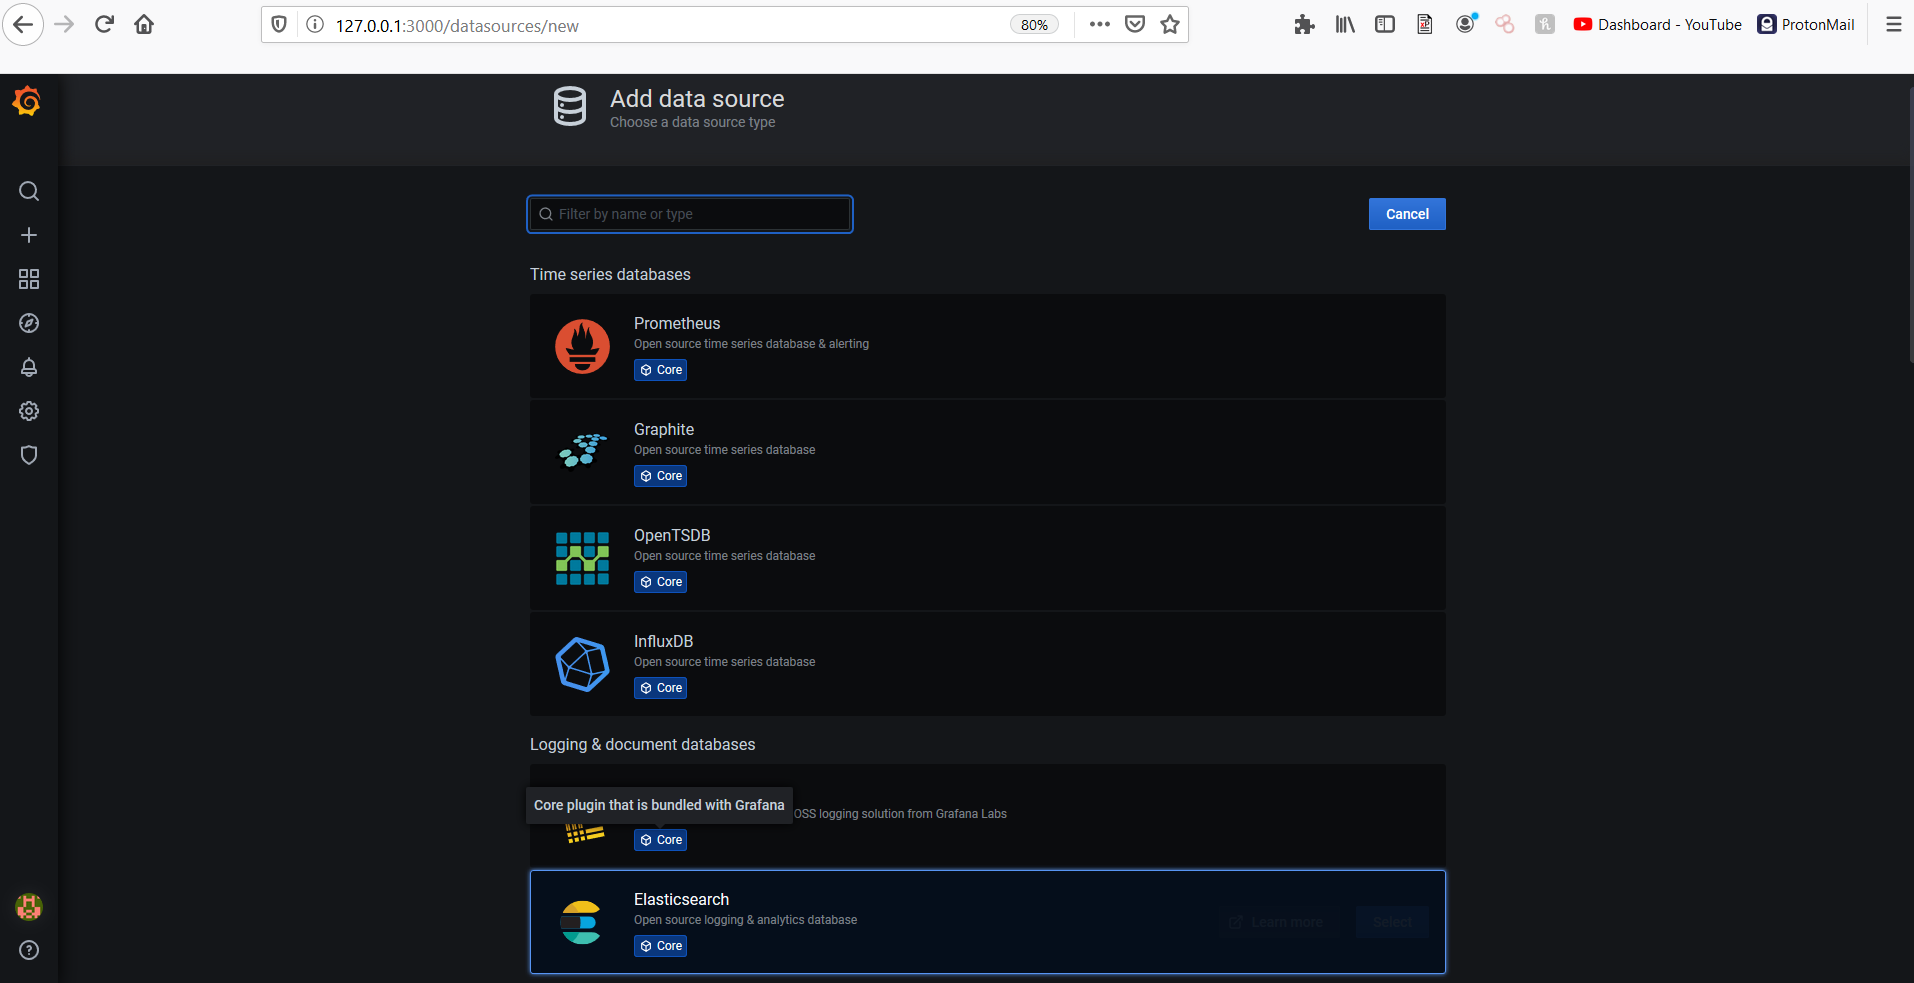
Upon logging in, the first thing we will want to do is configure Prometheus as a Data Source.
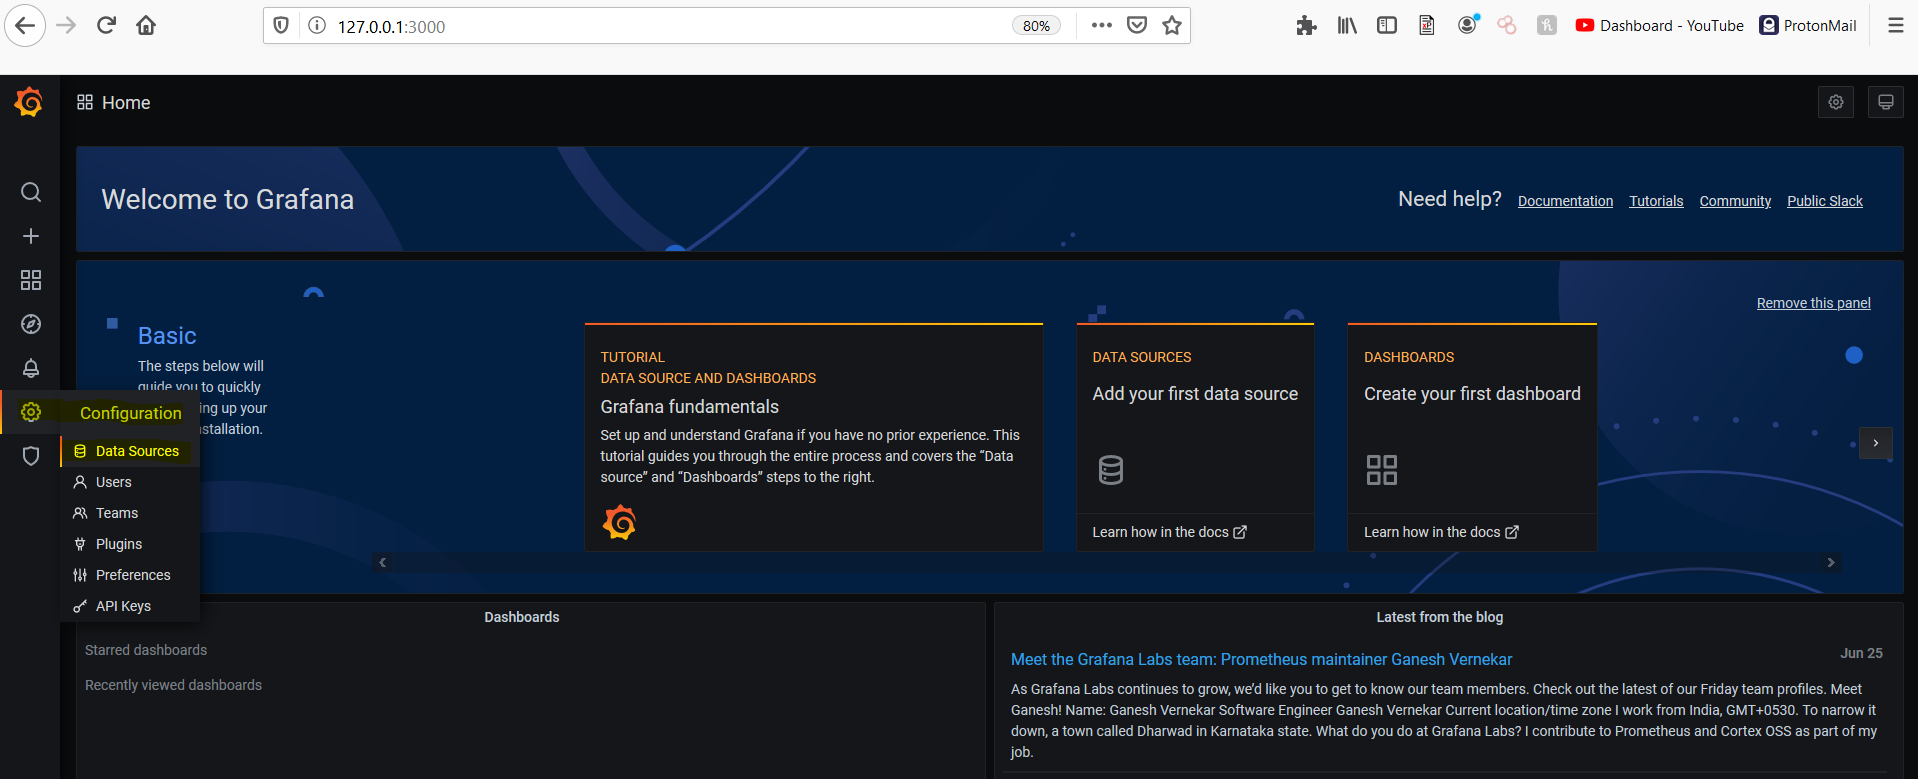
Go ahead and choose to add Prometheus as a new Data Source:
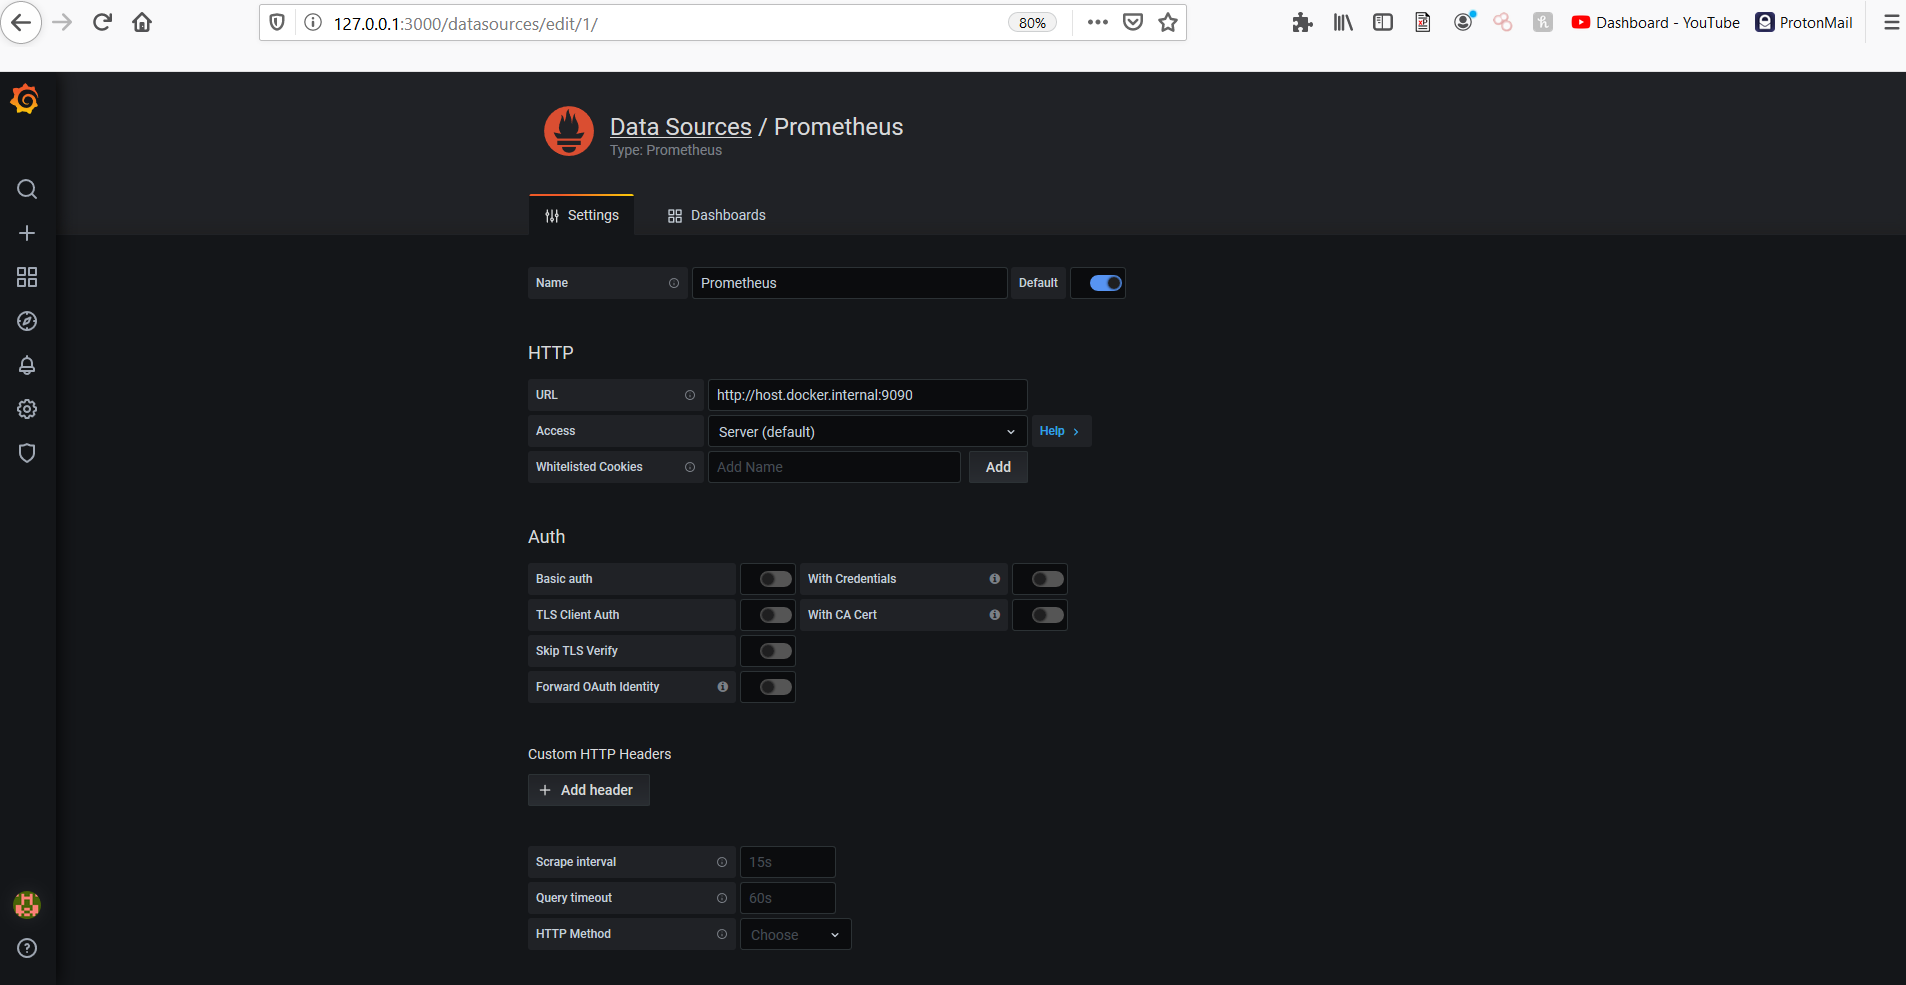
In the URL field, enter http://host.docker.internal:9090, and then click "Save & Test".
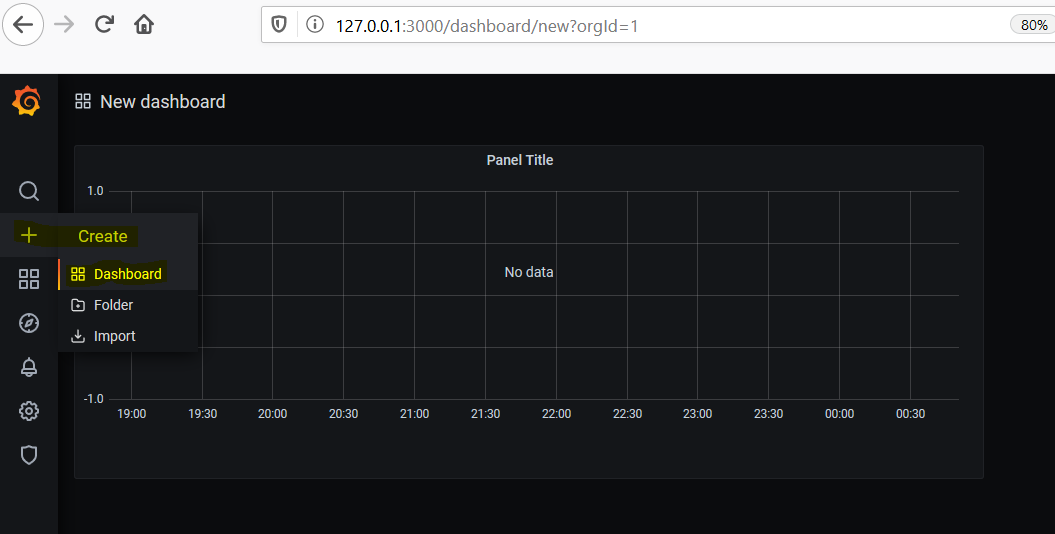
Now let's create a new dashboard to visualize our Synthetic Transaction metrics that Prometheus is currently collecting. On the left-hand side of the screen, select the + and choose Create Dashboard.
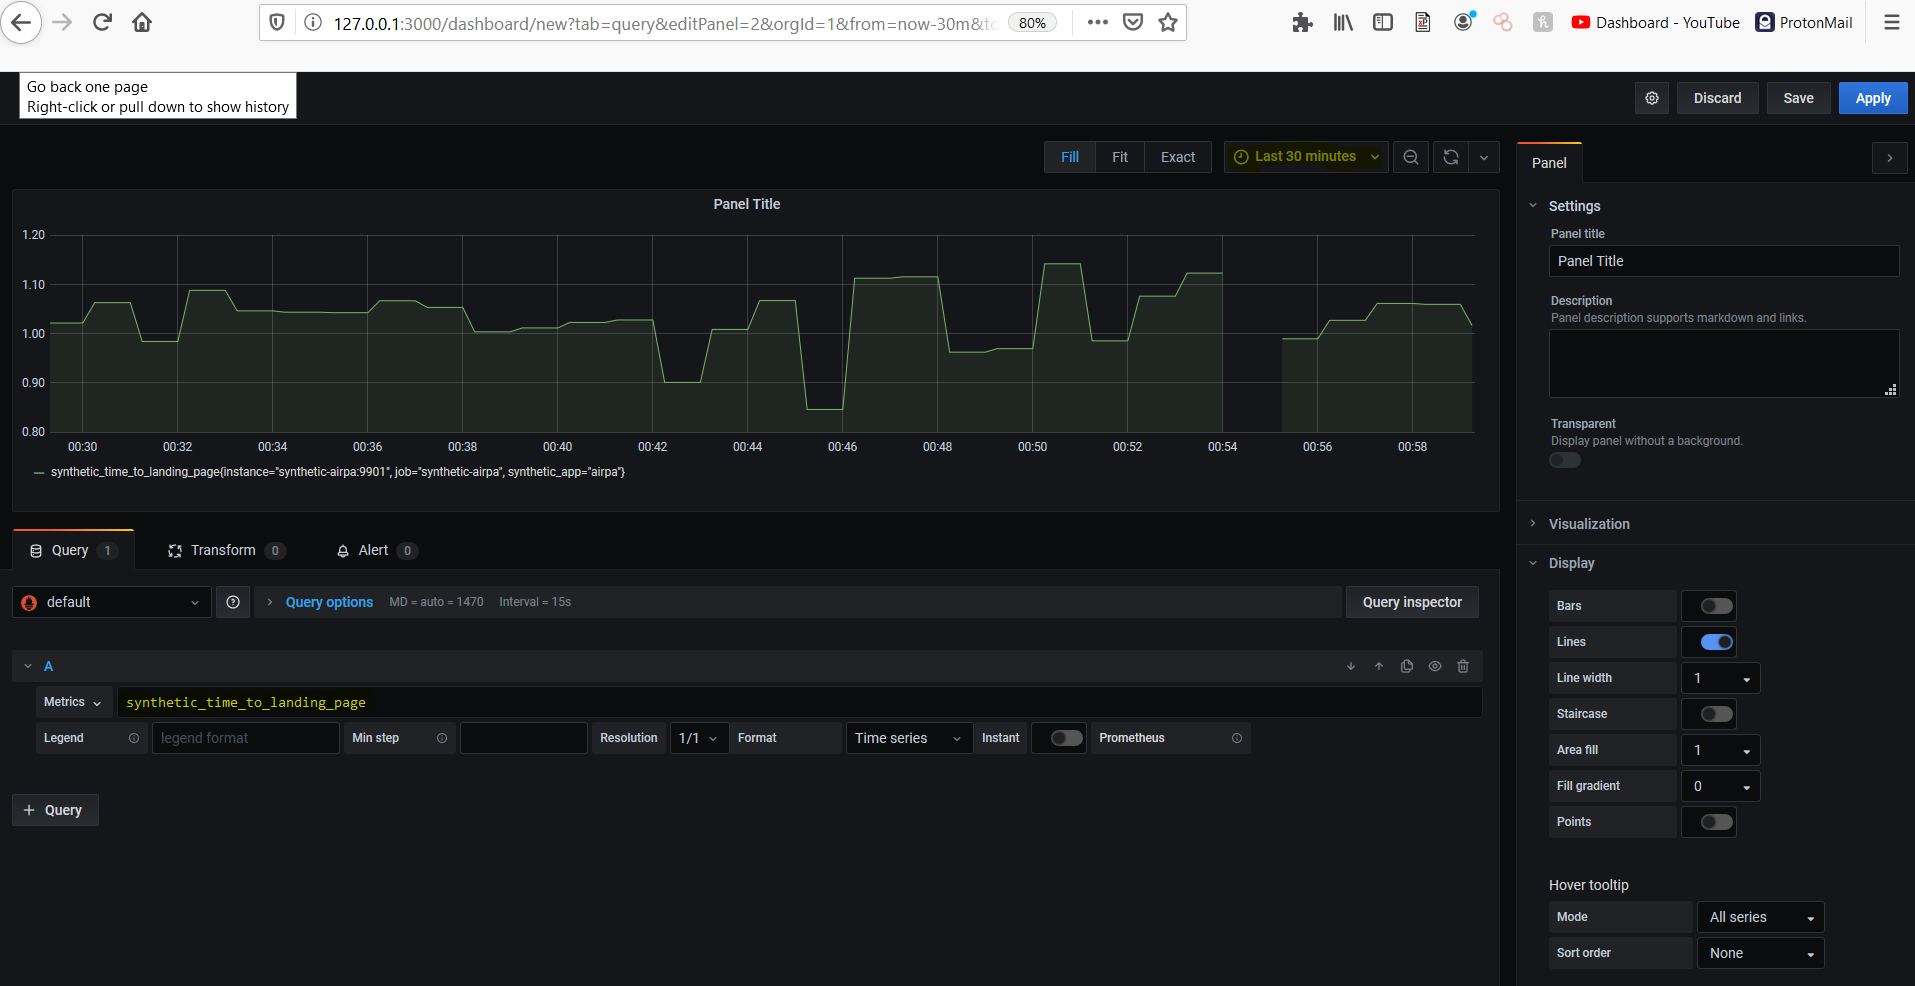
Click the "dropdown arrow" next to the Panel Title on the panel you are presented with and choose "Edit". This is where we create the query for the data we want. In the field for the query, type in "synthetic_time_to_landing_page". You might want to change the time span from the default "Last 6 hours" to "Last 30 minutes" or so. Your panel editor should look like this:
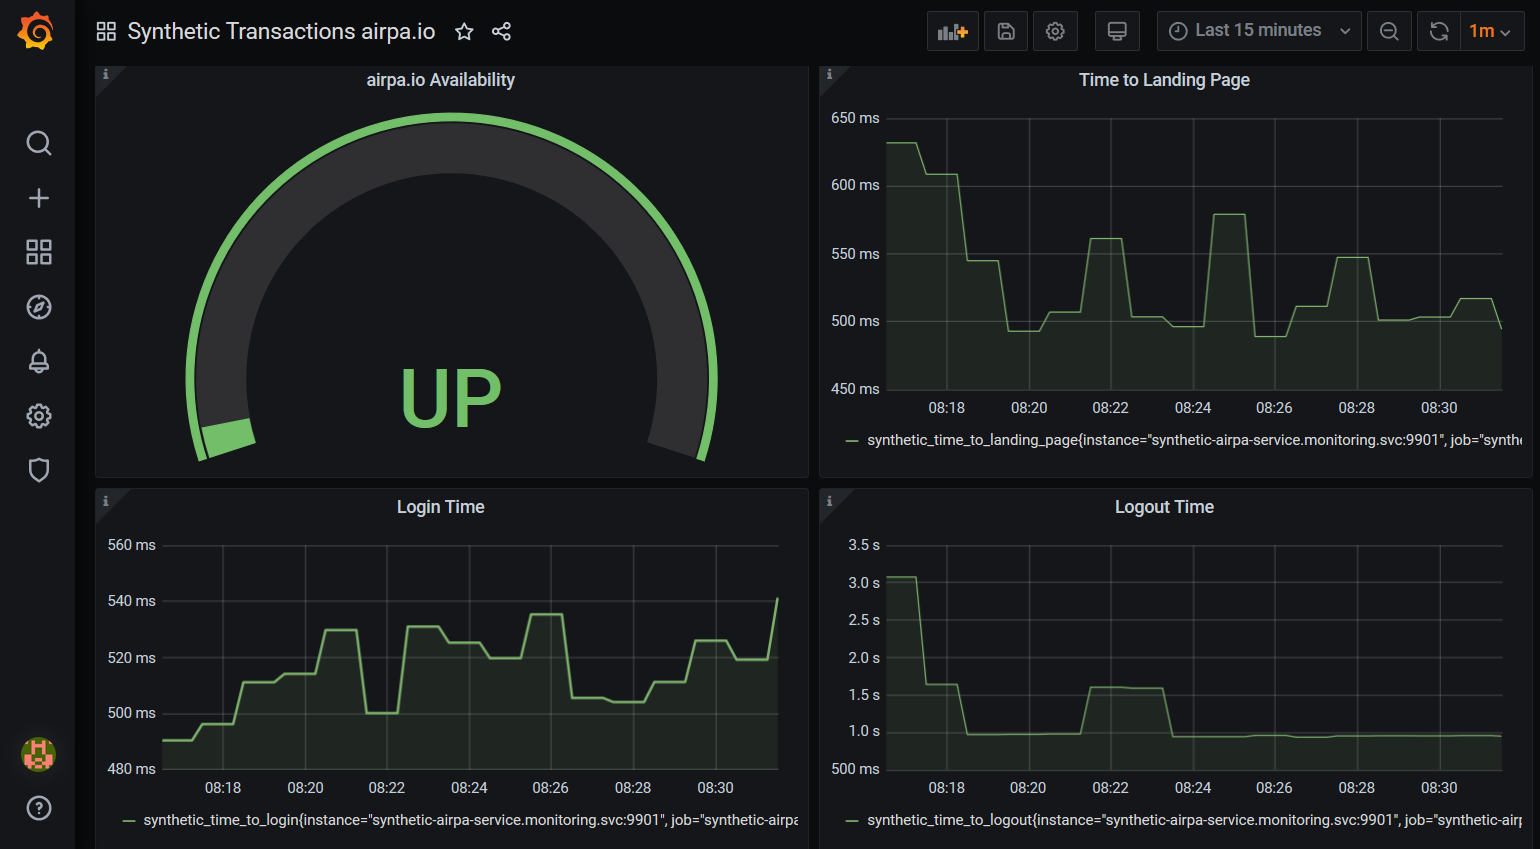
At this point, I will encourage you to explore Grafana and play around with this use case a bit more. Go ahead and add visualization for the other two metrics in our Synthetic Transaction project, and give your dashboard a name. Save the dashboard, and notice that there is built-in version control available for your dashboards that you create.
Here is my final Synthetic Transactions dashboard:
One last thing before we wrap up. Let's stop our Container applications by running the command
docker-compose down
Once you Containers shut down, go ahead and start them back up again with
docker-compose up -d
You should notice that all of your metrics data has persisted across this restart and your previously created dashboard should still be available to you. This is made possible by utilizing Docker Volumes which we defined in the docker-compose.yml file. Don't forget to stop your Containers when you're done; you don't want to fill up your local disk space with a lot of metrics data!
Wrapping Up
We covered quite a bit in this post! We got an introduction to how Prometheus and Grafana work and how they form a basis for an opensource monitoring and observability platform. We instrumented our Synthetic Transactions code to export metrics to Prometheus and built a new Docker Image to hold that code. Then we figured out how to spin up multiple Containers fairly easily. Once we had our monitoring applications up and running, we quickly built a dashboard in Grafana to visualize the Synthetic Transaction metrics that Prometheus is collecting.
That was a lot to digest, but it moved us closer to forming our end-to-end solution for a monitoring and observability platform. In the next and final post in the series, I would like us to explore how we can host this end-to-end solution on an AWS Cloud infrastructure.
Check out Part 4 - Monitoring With Prometheus On Containers In The Cloud