

7/6/2020
In our last post, https://airpa.io/post/synthetic-transactions-prometheus-grafana, we took our UI automation project to capture metrics on Synthetic Transactions, and setup Prometheus and Grafana to continuously pull those metrics and show them in a dashboard. Don't forget, we were running everything in Docker Containers, albiet the whole platform was running on our local machine using Docker Compose. In this post, we will be focusing on Container Orchestration, and setting up infrastructure on AWS, utilizing Kubernetes to run our Container workload.
WARNING: The AWS resources discussed in this blog post are not free. If you choose to mimic the usage of these AWS resources, we estimate that you will incur a charge of about $0.20 USD per hour. The steps we go through of setting up the AWS infrastructure are fairly easy to complete, and at the end of the post, we will show how to clean-up and remove the AWS resources to stop incurring charges. Please be mindful of you own costs and use the AWS services at your own risk.
The Technology
We have learned how easy it is to package our applications in Docker Containers, which are extremely portable to any other environment which has an underlying Docker Engine to run containers on. We have also seen how easy it is to run multiple Containers all at once using Docker Compose. While our project has only been using three Containers, what if we needed to scale up our project? What if we were put in charge of monitoring hundreds of applications, databases, and servers? We might have a separate Container running a microservice to collect metrics on one particular part of an application. We could potentially end up using hundreds or thousands of Containers to monitor various applications and infrastructure. In cases like this, it would likely help to utilize some type of Container orchestration tool.
Kubernetes
The Container orchestration tool with the largest community following, support, and usage is Kubernetes. This is also helped by the fact that Kubernetes is open-source software. It's so popular that major technology companies are integrating it's core into their own managed service offerings to profit from it's popularity.
Fun Fact: Kubernetes was the first project that graduated from the Cloud Native Computing Foundation's (CNCF) incubation program. Wanna guess which was the second CNCF graduated project? Prometheus!
The core of the Kubernetes workload is a Cluster of servers we call Nodes. For our small project we will utilize one node, but scaling up could potentially involve hundreds or thousands of nodes depending on just what kind of workload you have. For application monitoring, I wouldn't expect to need thousands or even hundreds of nodes due to the nature of the problem, unless you just have a gargantuan project on your hands. However, for something like large compute intensive data ETL or machine learning workloads, we just might encounter the need for hundreds or thousands of nodes.
So with the need of only using a few nodes in a Cluster, how else might Kubernetes help us on an application monitoring project? One thing that Kubernetes does well is to ensure that an application is always available or in some well defined desired state. If for some reason our containerized application running on a Kubernetes Pod becomes unhealthy or goes down, a simple configuration in Kubernetes can ensure that a new Pod will spin up in it's place and automatically make the application available again.
Did you notice how we mentioned the phrase "configuration in Kubernetes" above? This is huge in working with Kubernetes! Once we have containerized an application, we can define the state for exactly how we want our application to run in a simple YAML manifest file. Then we run a simple command to deploy this configuration to our Kubernetes Cluster, and boom! Kubernetes works it's magic and makes our application available for use!
The key point to remember here is to always, declaratively, define your application state in a manifest file. Of course you could set parameters and deploy using long command line arguments, but that can make things difficult and unpleasant very quickly. Defining your applications to run on Kubernetes in a declarative fashion invites the opportunity to make use of CI/CD tools, and before long you realize that your developers are focused more on developing applications rather than being concerned with how those applications need to be deployed on some kind of infrastructure. Kubernetes brings automation in at it's finest!
Now, the goal of this post is to show how to setup and run a monitoring platform on Kubernetes rather than to teach how to use Kubernetes. There are several valuable resources around the internet that do a great job at bringing one up to speed with the theory and inner workings of Kubernetes, and we assume that you already have a basic knowledge of Kubernetes while following along here. With that behind us, let's have a look at some of the other technology that we will be using.
Amazon ECR
Elastic Container Registry is a service hosted by AWS where we can keep and store our Docker Images. It is very similar to Docker Hub, however, ECR can be thought of as a private registry that integrates well with other AWS Container services. ECR is not free, and costs a whopping $0.10 USD per GB per month for storage. Fortunately, this will hardly impact our budget for this three Container project. Keep in mind that if you do intend to keep a bunch of images in ECR, then pulling those images out to your local machine (or anyone else's) will incur Transfer Out charges of somewhere between $0.05 and $0.09 USD per GB for transfers greater than 1GB.
Amazon EKS
Elastic Kubernetes Service is a fully managed Kubernetes service. What this means is that Amazon is in charge of running your Kubernetes Control Plane, keeping it available, secure, and patched. This service comes with a management fee of $0.10 USD per hour. This is comparable to other Cloud providers running managed Kubernetes services:
- Azure Kubernetes Service - free
- Google Kubernetes Engine - $0.10 USD /hr
Also, there are other container orchestration services that could be proprietary, free, easy to use, etc. but which may not run with a Kubernetes engine, take for example Amazon's Elastic Container Service. The beauty of running with Kubernetes is that your Kubernetes configurations and workloads are not locked in to a single Cloud provider. They are portable across any Cloud provider running a managed Kubernetes service, or you could even take the time to learn and run your own Kubernetes Cluster on your own infrastructure if that's what you're interested in. Whether you use Amazon or some other less expensive managed Kubernetes service, the potential $876 USD per year of running a third-party managed Kubernetes Cluster may just be well worth the time and money rather than having to learn or hire to manage the infrastructure yourself.
Well, that's all as far as the technology is concerned, so let's get this thing going!
Prep For EKS
Once again, we are working from a Windows machine here, and the exact format of commands to run on your machine may vary. If you're are also working on Windows, you may find the AWS Tools for PowerShell helpful, and we will be using PowerShell going forward.
Pushing Docker Images to ECR
So in previous posts, we had either built or used three different Container Images:
- prom/prometheus
- grafana/grafana
- prometheus-synthetic-airpa
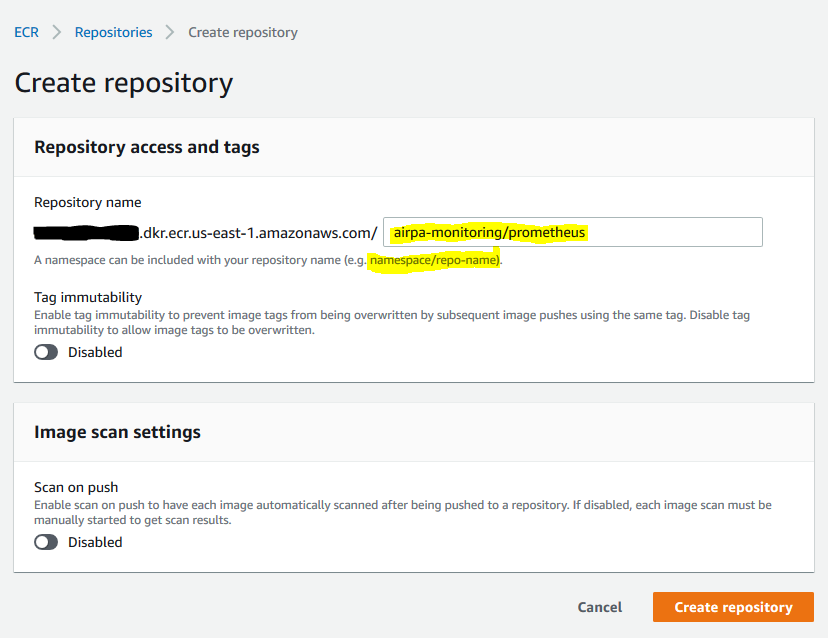
In ECR we will be creating a separate repository for each of these three images. First of all, we need to connect our local docker client to our own amazon ECR, and we do so by running the following command. Just be sure to use your own AWS account number.
(Get-ECRLoginCommand).Password | docker login --username AWS --password-stdin <yourAWSAccountNumber>.dkr.ecr.us-east-1.amazonaws.com
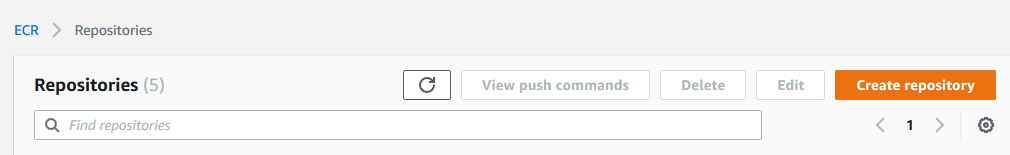
Now that we have our Docker client communicating with our AWS account, we need to create our ECR repositories that we can push our images to. We do this in the AWS Console by navigating to https://console.aws.amazon.com/ecr/repositories?region=us-east-1, and clicking on the orange "Create repository" button:
Name your repository with a "namespace/repo-name" format. Your's may look something like:
Now we just need to tag our image and push it to the ECR repository we created. You might find a "View push commands" button in your AWS Console, but it really boils down to two commands:
- Tag
docker tag prom/prometheus <yourAWSAccountNumber>.dkr.ecr.us-east-1.amazonaws.com/airpa/prometheus:latest
- Push
docker push <yourAWSAccountNumber>.dkr.ecr.us-east-1.amazonaws.com/airpa/prometheus:latest
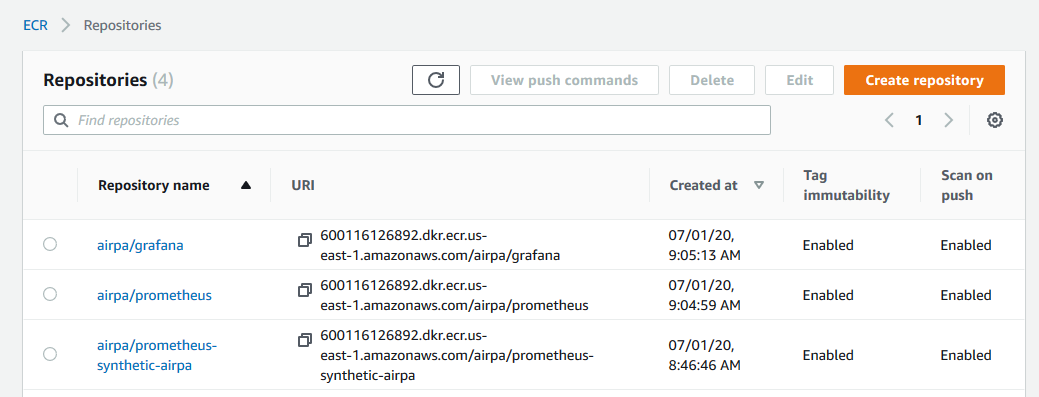
Larger images may take a couple of minutes to transfer the data to ECR. Just perform the tag/push steps two more times to push the Grafana and prometheus-synthetic-airpa images to ECR, and your repositories should look similar to:
Deploy to Kubernetes on EKS
Before we spin up an EKS Cluster, let's take care of a few prerequisites.
IAM Role
We need to create an IAM Role that gives permissions to execute actions on the EKS Cluster that we spin up. Without this IAM Role, we will not be able to do anything with our EKS Cluster because AWS will spin up a Cluster with a deny-everything Kubernetes role by default.
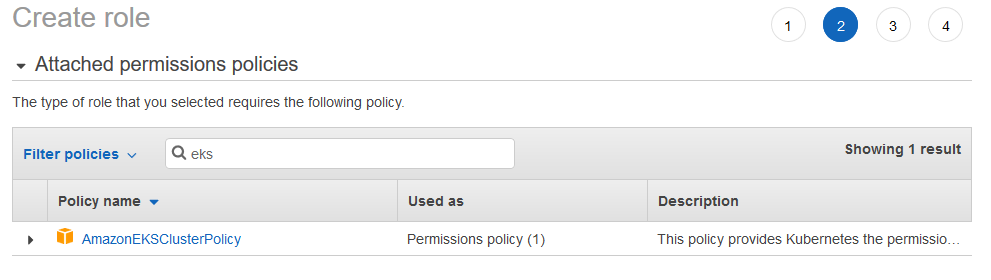
Navigate to IAM in the AWS Console and select "Create Policy". We will want to name our Role something like "EKSClusterRole" and attach the AmazonEKSClusterPolicy to the Role:
The VPC
In order to run an EKS Cluster, you will need a VPC. If you have an AWS VPC already, then great, you can probably just use it as long as it meets some subnet requirements. If you need a VPC, then create a CloudFormation stack using the CFT at https://amazon-eks.s3.us-west-2.amazonaws.com/cloudformation/2020-06-10/amazon-eks-vpc-private-subnets.yaml
More detailed information about the VPC requirements for your EKS Cluster can be found at https://docs.aws.amazon.com/eks/latest/userguide/create-public-private-vpc.html, but basically EKS requires subnets in at least two Availability Zones. It is common to choose one of the following three options to meet the subnet requirements:
- 2 Public and 2 Private Subnets - Kubernetes can create a public facing load-balancer in your public subnet while other worker nodes can communicate in your private subnet
- 3 Public Subnets - everything runs in a public facing subnet, including your worker nodes
- 3 Private Subnets - everything runs in a private subnet, and any load-balancers that Kubernetes creates cannot be public facing.
I already have a VPC which meets all of the above options, and going forward we will be working with option 1 with two public and two private subnets. We won't be spinning up a load-balancer in this demo (which would incur extra cost), but just in case you would like to, this option enables that capability.
Choose a Method to Spin Up EKS Cluster
There are basically three methods for spinning up an EKS Cluster. We will be using option 2 for this post.
- Use the AWS Console. Use this method if you like to control everything using the web UI. With this method, you can essentially define how you want your worker nodes to behave, and Amazon will fully manage your worker nodes.
- Use the
eksctlcommand line utility. The official AWS EKS CLI is a utility written in Go and uses CloudFormation to easily spin up and control EKS Clusters. This is probably the fastest and easiest way to spin up an EKS Cluster in AWS. - Use CloudFormation. If you think you need more control over your Cluster and worker nodes, then use CloudFormation. A helpful CFT to start with can be found at https://amazon-eks.s3.us-west-2.amazonaws.com/cloudformation/2020-06-10/amazon-eks-nodegroup.yaml. Just pick and choose which parameters you might need to use, and create the stack.
Creating the EKS cluster
Using the eksctl utility, we can spin up a new Cluster with a simple one-line command. However, we will pass in a YAML configuration file as an argument.
# cluster-config.yml
apiVersion: eksctl.io/v1alpha5
kind: ClusterConfig
metadata:
  name: airpa
  region: us-east-1

vpc:
  id: vpc-3d6f3dc5
  cidr: "172.31.0.0/16"
  subnets:
    public:
      us-east-1d:
        id: subnet-a4c935f4
      us-east-1f:
        id: subnet-ef61c8a2
    private:
      us-east-1a:
        id: subnet-b0f32c015f51b9a3d
      us-east-1b:
        id: subnet-b3fc0a2f65d3c69fc

nodeGroups:
  - name: eks-worker-01
    instanceType: m5.large
    desiredCapacity: 1
In the cluster-config.yml file, we specify the Cluster name "airpa", as well as the VPC with the two public and two private subnets, and finally a single worker node. With that in place, we run the simple command below to spin up our new EKS Cluster.
eksctl create cluster -f cluster.yml --kubeconfig=C:\Users\username\.kube\config
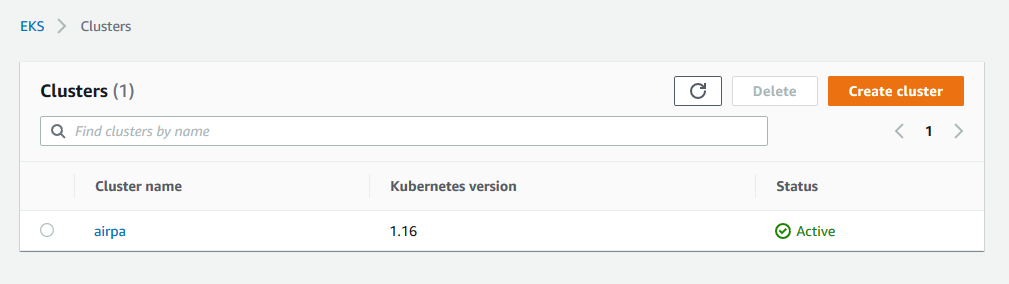
Note that the --kubeconfig flag points to a location where your EKS Cluster credentials will be written to. Make yourself a cup of coffee and kick back and relax because, it will take a a bit for your EKS Cluster to spin up. You must wait until your new EKS Cluster is in an ACTIVE state before proceeding with the next steps.
Configure kubectl
Before we can interact with our newly created EKS Cluster, similar to how we needed to get our Docker client to talk to ECR, we will need to setup our configuration to talk to EKS.
Visit https://docs.aws.amazon.com/eks/latest/userguide/install-aws-iam-authenticator.html and follow the directions for your platform to install the aws-iam-authenticator. This utility enable us to authenticate to our EKS Cluster via IAM. However, other RBAC controls for Kubernetes are still administered through your general Kubernetes RBAC configuration. To setup this configuration, just run this command:
aws eks update-kubeconfig --name airpa
This will update your --kubeconfig=C:\Users\username\.kube\config with the appropriate credentials needed for kubectl to communicate with your new cluster. To confirm that kubectl is indeed working with your EKS Cluster, run the command
kubectl cluster-info
where you should see details in the output related to your EKS Cluster.
Deploying to EKS
Now that we can communicate to our EKS Cluster from our local machine, we are ready to start deploying. Now, fair warning, we are going to see a lot of repeated "config / apply" steps coming up, and that is due to the very nature of how Kubernetes should be operated, i.e. declaritively. It is possible to apply some of the steps below with one manifest file, but for this demonstration we will separate and call out each type of manifest for a short discussion, at least for the Prometheus portion.
Create a Namespace
Initially, we are in the default namespace on our EKS Cluster. Creating namespaces give us the benefit of separating environments within our Cluster. Keep in mind that our Cluster could be shared by multiple applications, or perhaps contain multiple development environments. Namespaces provide a simple way to keep these environments separated. We will create a namespace with the name "monitoring" which will host everything that we deploy related to application monitoring. We can configure this namespace in a simple YAML file:
# namespace.yml
apiVersion: v1
kind: Namespace
metadata:
  name: monitoring
  labels:
    name: monitoring
Creating this namespace on our Cluster is a matter of running the command
kubectl apply -f namespace.yml
Create a Cluster Role for Prometheus
Prometheus needs a Cluster Role in order to communicate with other components in the Cluster. We define the Cluster Role in a YAML manifest file like the following using RBAC rules:
# cluster-role.yml
apiVersion: rbac.authorization.k8s.io/v1
kind: ClusterRole
metadata:
  name: prometheus
rules:
- apiGroups: [""]
  resources:
  - nodes
  - nodes/proxy
  - services
  - endpoints
  - pods
  verbs: ["get", "list", "watch"]
- apiGroups:
  - extensions
  resources:
  - ingresses
  verbs: ["get", "list", "watch"]
- nonResourceURLs: ["/metrics", "/synthetic-metrics"]
  verbs: ["get"]
---
apiVersion: rbac.authorization.k8s.io/v1
kind: ClusterRoleBinding
metadata:
  name: prometheus
roleRef:
  apiGroup: rbac.authorization.k8s.io
  kind: ClusterRole
  name: prometheus
subjects:
- kind: ServiceAccount
  name: default
  namespace: monitoring
We apply the Cluster Role with the command
kubectl apply -f cluster-role.yml
The Storage Class
EKS (and you may find this with other managed Kubernetes services as well) doesn't have a default storage class. This means that any requests for Persistent Volumes will not automatically be fullfilled. So for EKS, we must define Storage Classes for our Cluster to use. The Storage Class we define will serve as the "default" Storage Class for our Persistent Volume Claims (PVC).
# monitoring-storageclass.yml
kind: StorageClass
apiVersion: storage.k8s.io/v1
metadata:
  name: monitoring
  namespace: monitoring
provisioner: kubernetes.io/aws-ebs
parameters:
  type: gp2
reclaimPolicy: Retain
allowVolumeExpansion: true
mountOptions:
  - debug
Take note of the allowVolumeExpansion: true setting we specified, you might need it later. We apply the Storage Class with
kubectl apply -f monitoring-storageclass.yml
The Prometheus Configuration
This is basically the prometheus.yml configuration file that defines it's configurations and targets to scrape. On Kubernetes, we can utilize a ConfigMap to define configuration files for Prometheus or any other type of application. Below is the prometheus-config-map.yml we use, and notice that we define our target for scraping the prometheus-synthetic-airpa Container just like we did in the previous post. In addition, we define several jobs for Kubernetes metrics which Prometheus can collect through automatic Service Discovery.
Selectively Disabling Auto-Discovery
We could have allowed the "synthetic-airpa" job to be auto-discovered as a Kubernetes Service, and completely omit it from the ConfigMap. However if that were the case, then the "synthetic-airpa" job would execute synthetic requests on the website at the rate of the global scrape_interval of 5 seconds. To disable this auto-discover behavior on specific Kubernetes Services, as you will see later, we specify the annotation prometheus.io/scrape: 'false' in the "synthetic-airpa-service" manifest.
# prometheus-config-map.yml
apiVersion: v1
kind: ConfigMap
metadata:
  name: prometheus-server-config
  labels:
    name: prometheus-server-config
  namespace: monitoring
data:
  prometheus.yml: |-
    global:
      scrape_interval: 5s
      evaluation_interval: 5s

    scrape_configs:
      - job_name: 'synthetic-airpa'
        scrape_interval: 1m
        scrape_timeout: 30s
        metrics_path: /synthetic-metrics
        static_configs:
          - targets: ['synthetic-airpa-service.monitoring.svc:9901']

      - job_name: 'kubernetes-apiservers'
        kubernetes_sd_configs:
        - role: endpoints
        scheme: https
        tls_config:
          ca_file: /var/run/secrets/kubernetes.io/serviceaccount/ca.crt
        bearer_token_file: /var/run/secrets/kubernetes.io/serviceaccount/token
        relabel_configs:
        - source_labels: [__meta_kubernetes_namespace, __meta_kubernetes_service_name, __meta_kubernetes_endpoint_port_name]
          action: keep
          regex: default;kubernetes;https

      - job_name: 'kubernetes-nodes'
        scheme: https
        tls_config:
          ca_file: /var/run/secrets/kubernetes.io/serviceaccount/ca.crt
        bearer_token_file: /var/run/secrets/kubernetes.io/serviceaccount/token
        kubernetes_sd_configs:
        - role: node
        relabel_configs:
        - action: labelmap
          regex: __meta_kubernetes_node_label_(.+)
        - target_label: __address__
          replacement: kubernetes.default.svc:443
        - source_labels: [__meta_kubernetes_node_name]
          regex: (.+)
          target_label: __metrics_path__
          replacement: /api/v1/nodes/${1}/proxy/metrics

      - job_name: 'kubernetes-pods'
        kubernetes_sd_configs:
        - role: pod
        relabel_configs:
        - source_labels: [__meta_kubernetes_pod_annotation_prometheus_io_scrape]
          action: keep
          regex: true
        - source_labels: [__meta_kubernetes_pod_annotation_prometheus_io_path]
          action: replace
          target_label: __metrics_path__
          regex: (.+)
        - source_labels: [__address__, __meta_kubernetes_pod_annotation_prometheus_io_port]
          action: replace
          regex: ([^:]+)(?::\d+)?;(\d+)
          replacement: $1:$2
          target_label: __address__
        - action: labelmap
          regex: __meta_kubernetes_pod_label_(.+)
        - source_labels: [__meta_kubernetes_namespace]
          action: replace
          target_label: kubernetes_namespace
        - source_labels: [__meta_kubernetes_pod_name]
          action: replace
          target_label: kubernetes_pod_name

      - job_name: 'kubernetes-cadvisor'
        scheme: https
        tls_config:
          ca_file: /var/run/secrets/kubernetes.io/serviceaccount/ca.crt
        bearer_token_file: /var/run/secrets/kubernetes.io/serviceaccount/token
        kubernetes_sd_configs:
        - role: node
        relabel_configs:
        - action: labelmap
          regex: __meta_kubernetes_node_label_(.+)
        - target_label: __address__
          replacement: kubernetes.default.svc:443
        - source_labels: [__meta_kubernetes_node_name]
          regex: (.+)
          target_label: __metrics_path__
          replacement: /api/v1/nodes/${1}/proxy/metrics/cadvisor

      - job_name: 'kubernetes-service-endpoints'
        kubernetes_sd_configs:
        - role: endpoints
        relabel_configs:
        - source_labels: [__meta_kubernetes_service_annotation_prometheus_io_scrape]
          action: keep
          regex: true
        - source_labels: [__meta_kubernetes_service_annotation_prometheus_io_scheme]
          action: replace
          target_label: __scheme__
          regex: (https?)
        - source_labels: [__meta_kubernetes_service_annotation_prometheus_io_path]
          action: replace
          target_label: __metrics_path__
          regex: (.+)
        - source_labels: [__address__, __meta_kubernetes_service_annotation_prometheus_io_port]
          action: replace
          target_label: __address__
          regex: ([^:]+)(?::\d+)?;(\d+)
          replacement: $1:$2
        - action: labelmap
          regex: __meta_kubernetes_service_label_(.+)
        - source_labels: [__meta_kubernetes_namespace]
          action: replace
          target_label: kubernetes_namespace
        - source_labels: [__meta_kubernetes_service_name]
          action: replace
          target_label: kubernetes_name
Prometheus Storage
Now we define the Persistent Volumes (PV), and Persistent Volume Claims (PVC) for Prometheus usage. We only specify 1Gi of storage for this demonstration, and during my implementation, that turned out to be a good value to use for a learning experience. Let me tell you why...
After we finish deploying everything and we let this run for just a little bit, we might start seeing some trouble with Prometheus. Digging in, we may find some error messages that read something like "WAL ... not enough space". If you encounter this, then just come back to the prometheus-storage.yml manifest and increase the storage volume size (and with grafana-storage.yml too) , and apply the manifest again. This is possible because of the allowVolumeExpansion: true setting in the Storage Class we defined.
# prometheus-storage.yml
kind: PersistentVolume
apiVersion: v1
metadata:
  name: prometheus-storage
  namespace: monitoring
spec:
  storageClassName: monitoring
  capacity:
    storage: 1Gi
  accessModes:
    - ReadWriteOnce
  persistentVolumeReclaimPolicy: Retain
  hostPath:
    path: "/prometheus"
---
kind: PersistentVolumeClaim
apiVersion: v1
metadata:
  name: prometheus-storage-claim
  namespace: monitoring
spec:
  storageClassName: monitoring
  accessModes:
    - ReadWriteOnce
  volumeMode: Filesystem
  resources:
    requests:
      storage: 1Gi
Apply the Prometheus storage manifest with
kubectl apply -f prometheus-storage.yml
The Prometheus Deployment
The Deployment manifest is where we actually specify the Containers we want to deploy into Pods. Best practice is to decouple applications as much as possible, and deploy as few Containers as possible in each Kubernetes Pod. Here, we deploy one Prometheus Container in one Pod. Later we will have another Pod with a Grafana Container and another with our Synthetic Monitoring Container.
# prometheus-deployment.yml
apiVersion: apps/v1
kind: Deployment
metadata:
  name: prometheus-deployment
  namespace: monitoring
  labels:
    app: prometheus-server
spec:
  replicas: 1
  selector:
    matchLabels:
      app: prometheus-server
  template:
    metadata:
      labels:
        app: prometheus-server
    spec:
      containers:
        - name: prometheus
          image: <yourAWSAccountNumber>.dkr.ecr.us-east-1.amazonaws.com/airpa/prometheus:latest
          args:
            - "--config.file=/etc/prometheus/prometheus.yml"
            - "--storage.tsdb.path=/prometheus/"
          ports:
            - name: prometheus
              containerPort: 9090
          volumeMounts:
            - name: prometheus-config-volume
              mountPath: /etc/prometheus/
            - name: prometheus-storage-volume
              mountPath: /prometheus/
      securityContext:
        fsGroup: 2000
        runAsNonRoot: true
        runAsUser: 1000
      volumes:
        - name: prometheus-config-volume
          configMap:
            defaultMode: 420
            name: prometheus-server-config
        - name: prometheus-storage-volume
          persistentVolumeClaim:
            claimName: prometheus-storage-claim
In this Deployment, we specify the ECR Repository Image that we pushed earlier for Prometheus. We also declare that this Prometheus Pod will use the PVC we defined in prometheus-storage.yml.
Also, note that we specify the prometheus-config-volume to be the ConfigMap that we applied earlier which contains the prometheus.yml configuration. If we ever need to change any Prometheus configurations in the ConfigMap, then we will need to re-apply the prometheus-config-map.yml and restart a new Prometheus Pod. There are a few different ways to "restart" a Pod:
- Simply delete the currently running Pod. Since the desired state is to have 1 replica Pod, then deleting the Pod will have the effect of automatically spinning up a new Pod in its place which will then read the
ConfigMapand be ready to go with any new configurations. - You could delete the Deployment, and then apply it again.
Apply the Deployment manifest with
kubectl apply -f prometheus-deployment.yml
The Prometheus Service
Now that we have deployed the Prometheus Pod, we will also want to deploy a Service so that we will be able to reach the Prometheus web UI from outside of our Cluster.
# prometheus-service.yml
apiVersion: v1
kind: Service
metadata:
  name: prometheus-service
  namespace: monitoring
  annotations:
    prometheus.io/scrape: "true"
    prometheus.io/port: "9090"
  labels:
    name: prometheus
spec:
  selector:
    app: prometheus-server
  type: NodePort
  externalIPs: [3.236.70.44]
  ports:
    - port: 9090
      targetPort: 9090
      nodePort: 30090
You will need to specify your own "externalIP" which is just the IP address of the worker node you are running in your Cluster.
The annotations we specify in the Service manifest allow for Prometheus to auto-discover the Kubernetes Service. That means that Prometheus will automatically discover and collect metrics on the Pod it is running in.
Apply the Service manifest with
kubectl apply -f prometheus-service.yml
Now you should be able to access the Prometheus web UI by navigating to http://3.236.70.44:30090.
If you have trouble reaching that endpoint, then you may need to take a look at the AWS Security Groups attached to your Worker Node EC2. You could define Inbound Rules to allow access from either 0.0.0.0./0 or just your own IP address to the port range 30000 - 32767. This should be sufficient for this exercise, but be sure to lock it down for any production work.
Deploying Grafana & synthetic-airpa Pods
The process for deploying Grafana and the synthetic-airpa Pods are laregly the same as it was with Prometheus. Rather than showing the manifests and going over each detail, let me just point you to the GitHub repository containing the manifests, and you can look over them yourself and apply them.
For the Grafana manifests, apply them in the order:
grafana-storage.ymlgrafana-deployment.ymlgrafana-service.yml
The synthetic-airpa Container doesn't need any storage, so we just combine the Deployment and the Service into one manifest file synthetic-airpa-deployment.yml and apply it.
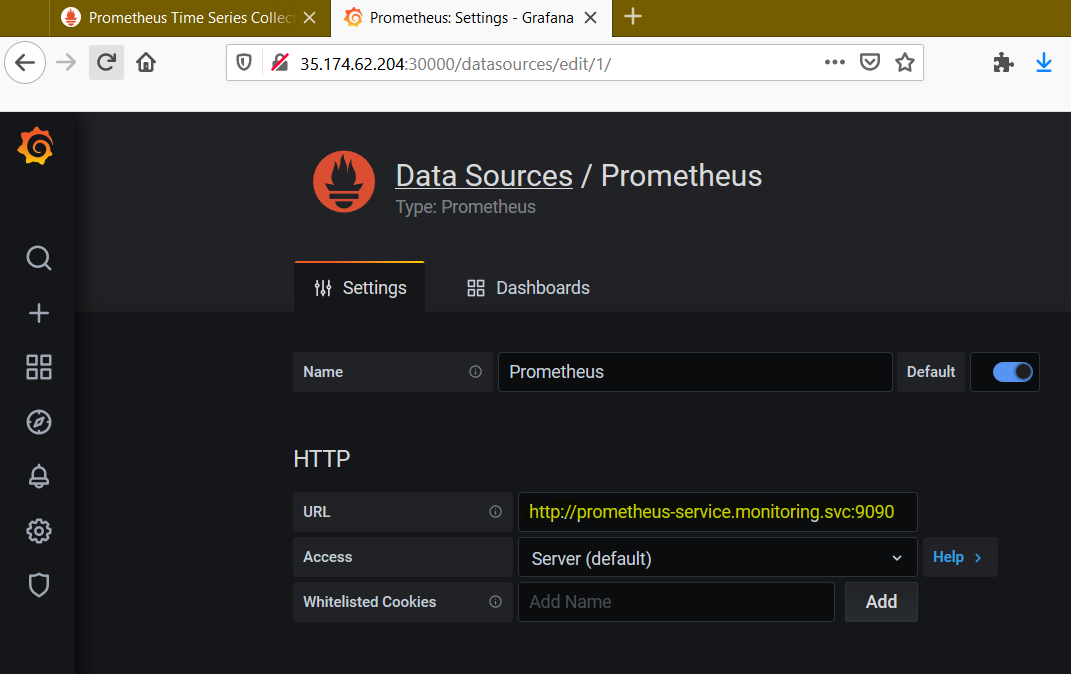
Grafana - Set Prometheus as Data Source
The URL for the Prometheus data source in Grafana is a little different that what we saw previously when using Docker Compose on our local machine. This time, it's Kubernetes Services that communicate with each other, and as such, there is a Service URL format we should use as shown in the screenshot below.
Grafana - Import Prebuilt Dashboards
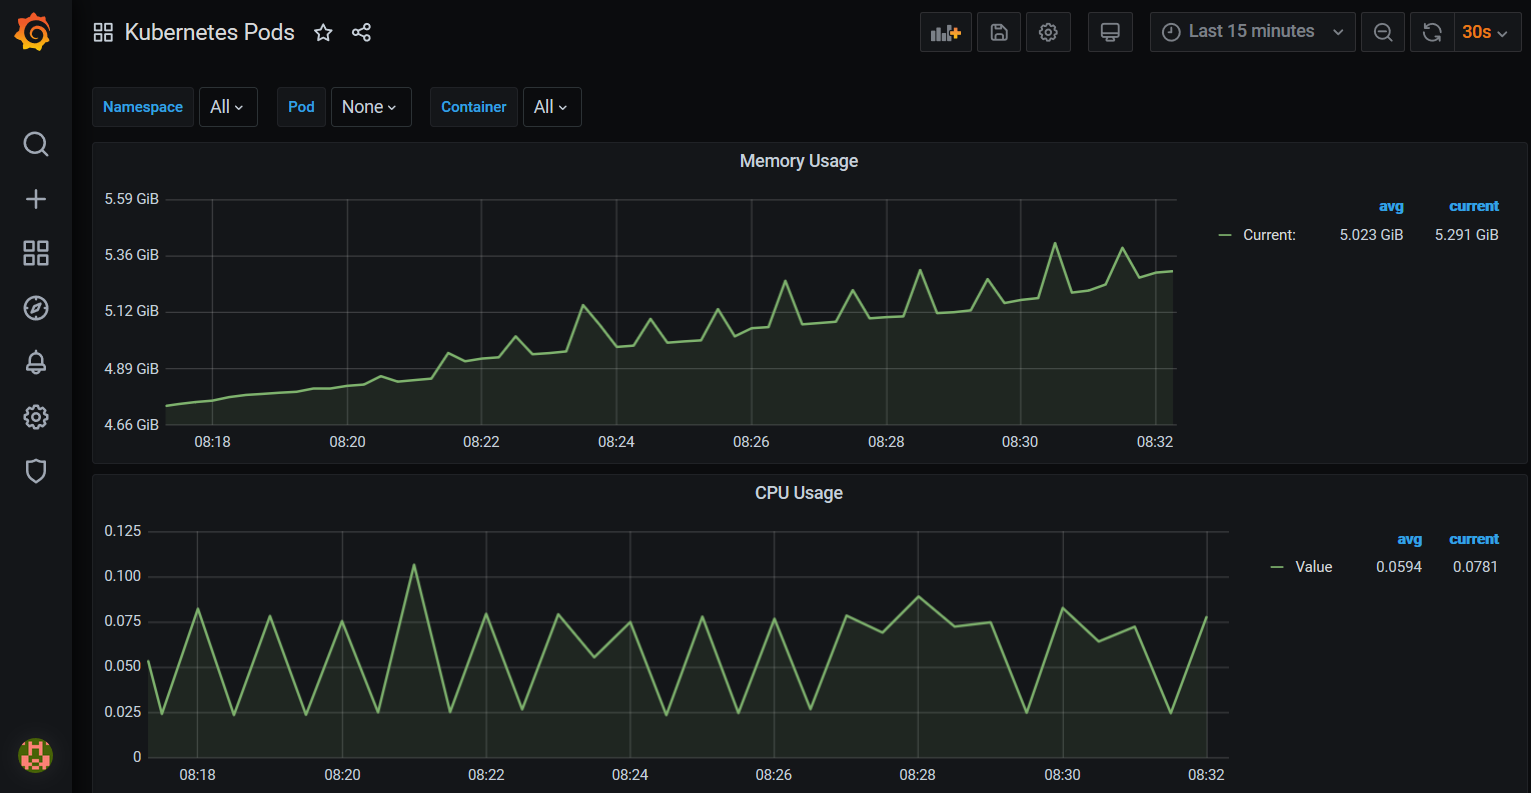
You can search https://grafana.com/grafana/dashboards for community-built dashboards that are simple to import into Grafana by specifying an ID, e.g. 3146 for a "Kubernetes Pods" dashboard.
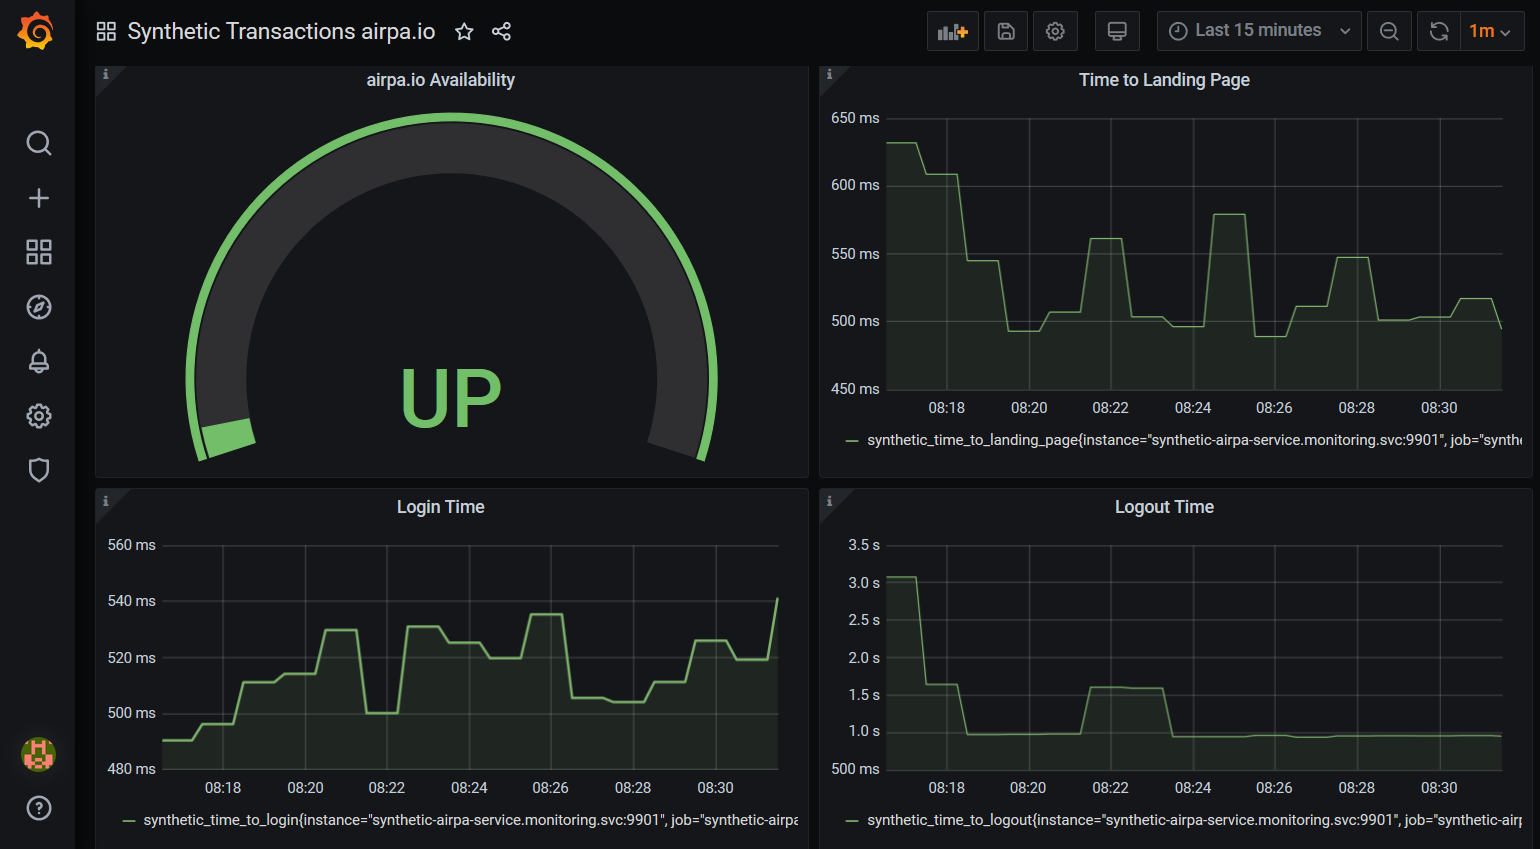
For the Synthetic Transactions dashboard, I have included synthetic-airpa-grafana-dashboard.json in the GitHub repo, which you can simply copy/paste into the Grafana dashboard import form.
Cleaning Up
Once you're done playing around with this monitoring platform running on EKS, you will want to take everything down and clean up your resources so that you won't contine to incur charges. In one command, and a minute or two later, your AWS Resources will be deleted.
eksctl delete cluster --name=airpa
Wrapping Up
That's it for this blog series. We started from building a simple web UI automation script to collect basic timing metrics, threw it in a Docker Container, learned how Prometheus can be used to continuously pull those metrics and visualize them with Grafana, then finally we spun everything up on a Cloud infrastructure running as a managed Kubernetes service. An end-to-end solution!
Where Else Can We Go?
Of course this is only just the beginning of the road for your journey with Monitoring and Observability with Prometheus and Grafana, and even for running Kubernetes workloads.
- Prometheus - I would encourage you to have a look and experiment with some of the third-party Exporters found at https://prometheus.io/docs/instrumenting/exporters/, such as the Node Exporter, the Blackbox Exporter, etc. They can be very easy to configure and use, and provide a basis for collecting valuable metrics.
- Grafana - take a look at some of the metric filtering and analytics capabilities that Grafana has, as well as the Alerting functionality.
- Kubernetes - an alternative, and perhaps much easier way to install and run Prometheus and Grafana on Kubernetes is to use Helm, a package manager for Kubernetes applications.
Now go forth and conquer with these new technologies you have learned - Happy hacking!